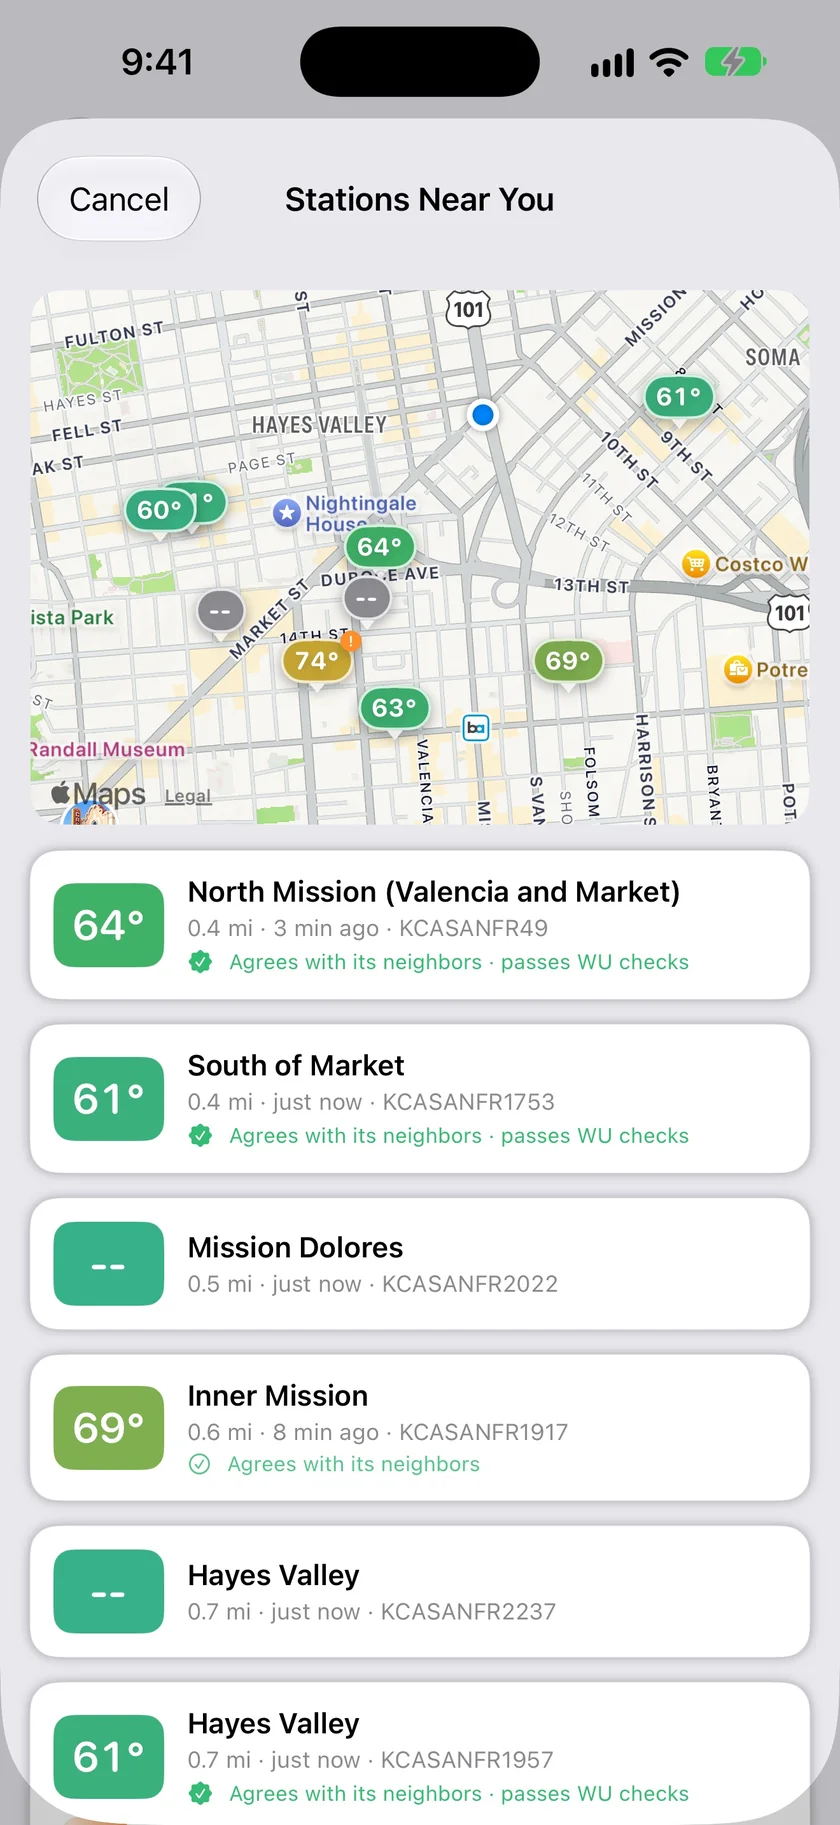
Microclimate Explorer, in short
- What it is
- Microclimate Explorer in Forecast Bar paints a map of a city's warm and cool neighborhoods from the personal weather stations around it, up to 150 at a time.
- Replay
- Microclimate Explorer replays the last 48 hours hour by hour, so you can watch a city pull apart and come back together.
- Views
- Relative shows each neighborhood as warmer or cooler than the city's middle, and Actual shows temperatures.
- Typical
- Typical mode shows how a city usually runs at each hour this season, once Forecast Bar has built up enough history for that city.
- Sharing
- Microclimate Explorer shares a card with a city's warm and cool areas, the gap between them and a two-day trend.
- Coverage
- Microclimate Explorer needs at least six trusted stations reporting around you. With fewer, it says there aren't enough stations here yet.
- No station needed
- Microclimate Explorer works without a personal weather station of your own, and it doesn't change your forecast.
- Plan
- Microclimate Explorer is part of Gold on iPhone and iPad, and Pro on the Mac.
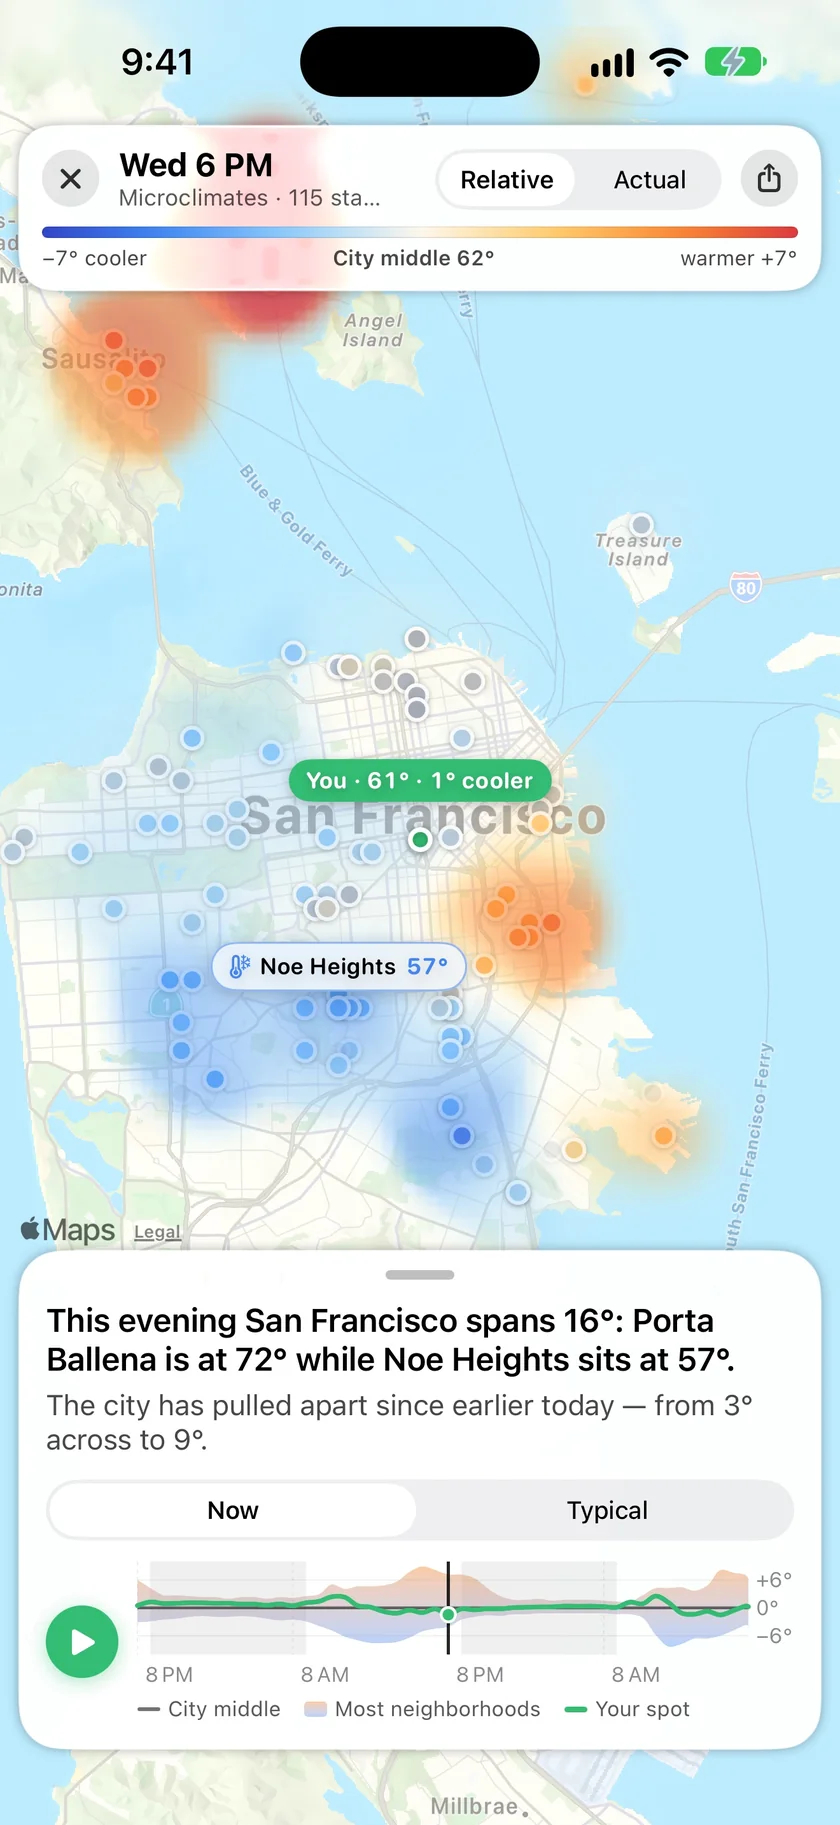
See how far apart your city is today.
The map paints warm and cool across the city from every trusted station around you, and pins your spot against the city's middle. A sentence at the bottom says what it shows, like how many degrees the city spans this evening and which neighborhoods are at each end.
- Warm and cool neighborhoods on one map
- Your spot against the city's middle
- Switch between Relative and Actual
- Tap a station to see it, then follow it
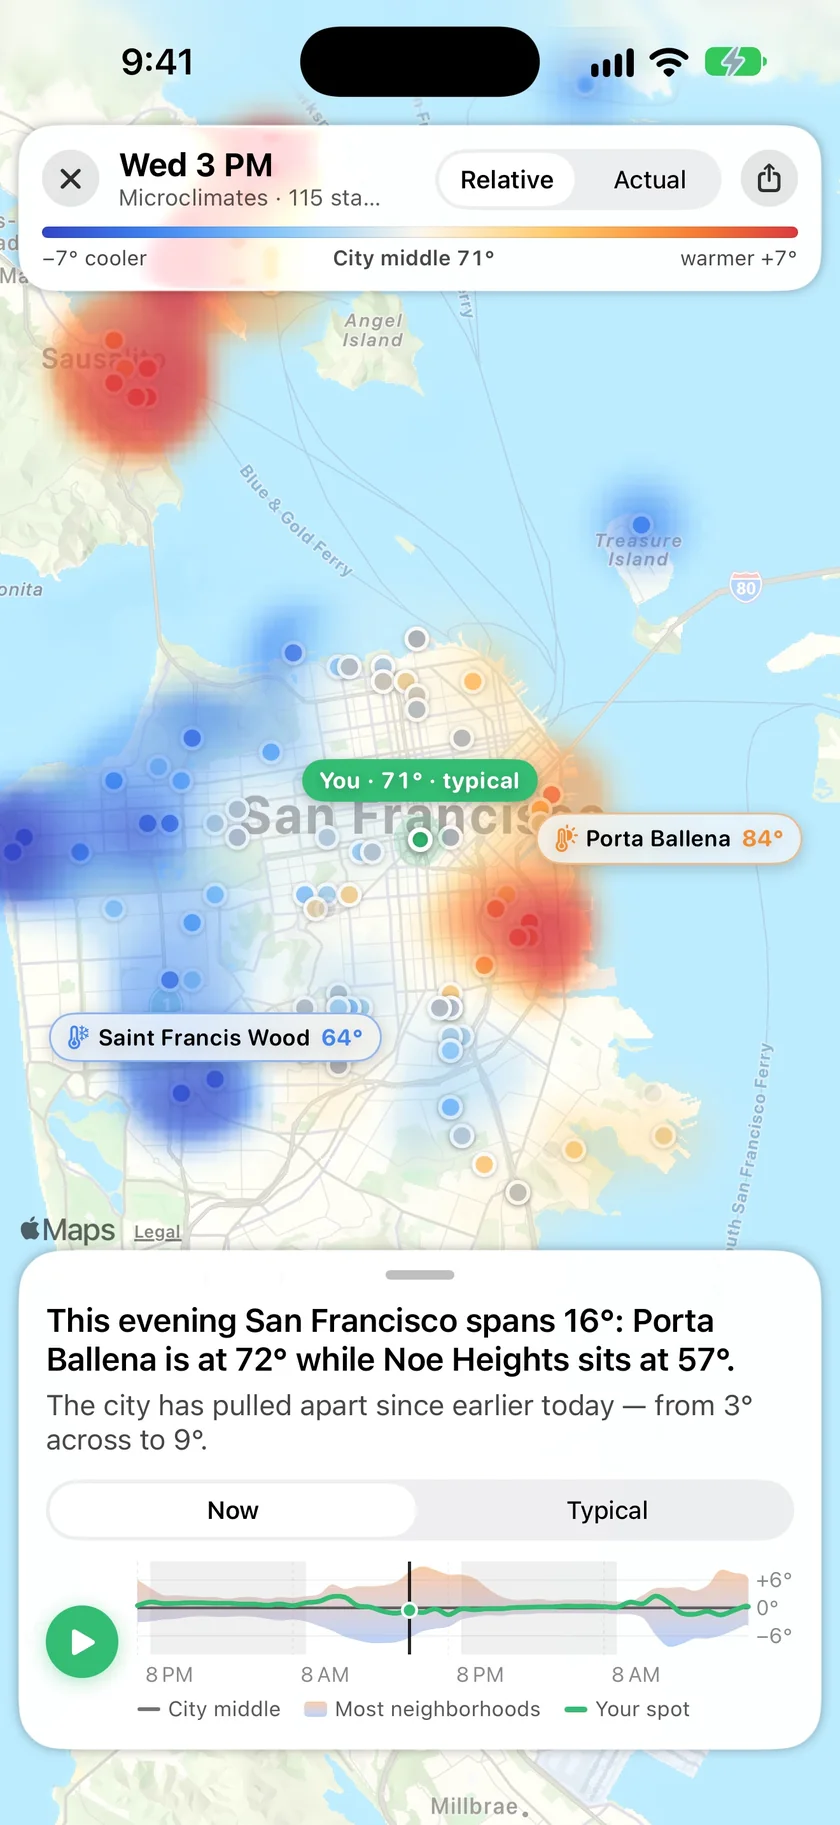
Watch the fog roll in.
Press play and the last 48 hours run across the map, one hour at a time, or drag the timeline yourself. The chart beneath shows the city middle, where most neighborhoods sat, and your own spot, so you can see when the city pulled apart. Typical shows how it usually runs through a day this season.
- Play or scrub the last 48 hours
- Your spot against most neighborhoods
- Typical mode, once your city has the history
- On the Mac it opens in its own window
Settle the argument about whose side of town is warmer.
The share button turns the map into a card with your city's warm and cool areas, the gap between them and a two-day trend, ready to send to the friend who swears their side of town is warmer.
- A card with the warm side, the cool side and the gap
- A two-day trend of how the gap moved
- Labelled with your city and the date
- On iPhone and iPad, find it at Settings, Features, Weather Station
An honest note: the map is only as good as the stations around you.
Microclimate Explorer needs at least six trusted personal weather stations reporting near you. Where there are fewer, it says there aren't enough stations here yet rather than painting something it can't back up. There's no fixed list of cities: it depends on who has a station on the Weather Underground network, and cities with more stations do better. Typical mode arrives city by city.
It shows what stations measured, now and over the last two days. It isn't a forecast of the coming hours, and it doesn't change the forecast on your main screen. Only your own personal weather station does that.
Questions about microclimates
Do I need my own weather station?
Does it work in my city?
What does Typical show?
Does Microclimate Explorer change my forecast?
Can I look at a city I'm not in?
Which plan includes Microclimate Explorer?
How much does Forecast Bar cost?

See how your city really runs.
Try Microclimate Explorer free for 7 days with a new iPhone or iPad Gold subscription.
Free to download; live weather requires a subscription. On iPhone and iPad, every subscription includes a 7-day free trial for new subscribers; Mac plans do not. Mac and iOS plans are separate; Apple TV is included with Forecast Bar Gold on iOS.
More from Forecast Bar
Personal weather stations
Your own station sets your current conditions and tunes your forecast. Follow nearby ones for reference.
UV index
UV by the hour for any forecast day, a custom UV alert, and a tile that rises when the sun does.
Pollen count
Today's tree, grass and weed pollen, worst first, with the tree species behind it. US only.