Every measurement Forecast Bar tracks has a full detail screen behind it — a graph or a purpose-built view, for any day in the forecast.
Opening the detail screen
There are three ways in from the main screen:
- Tap the current conditions card — opens today's temperature detail.
- Tap any data point tile in the tiles row — opens that data point.
- Tap an hour inside an expanded day in the daily forecast — opens the detail for that exact day and hour.
Tapping certain notifications (like a Beautiful Sunset alert) also lands you here.
The day selector
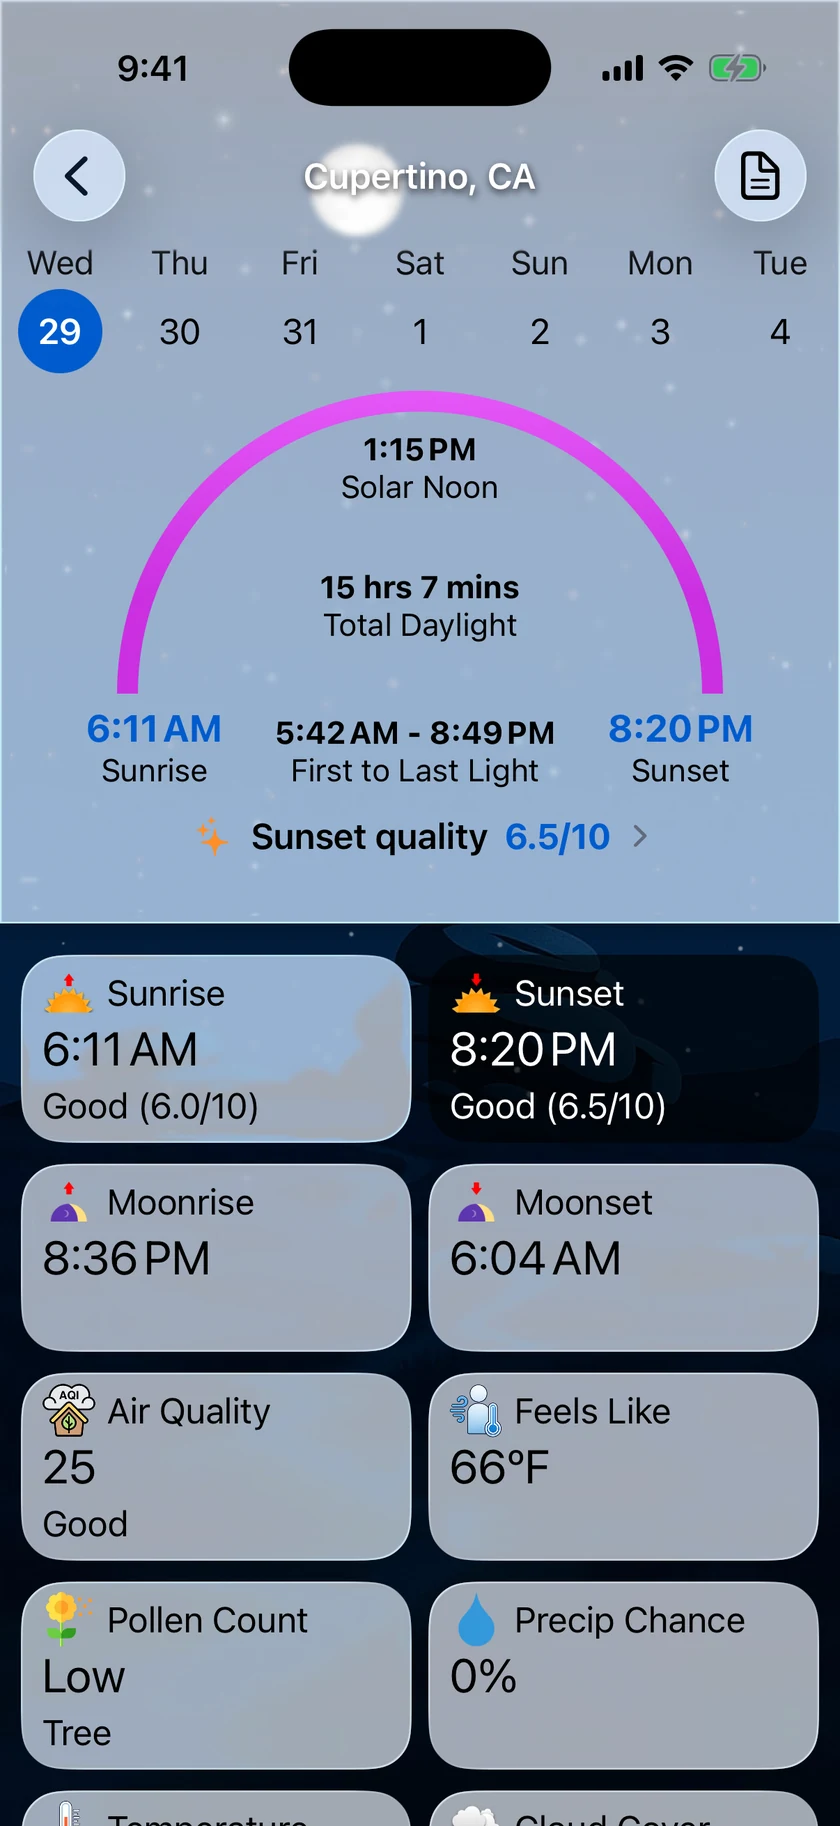
A strip of days runs across the top of the screen. Tap any day to see that day's version of the current data point — the graph, times, and values all update. The bottom grid updates too, so you can browse any data point for any forecast day.
The graph
Most data points display as a graph of the day's hourly values. Touch and drag across the graph to scrub — a readout follows your finger with the exact value and time for each hour.
Special detail views
A few data points get richer, purpose-built screens instead of a plain graph:
Sunrise & Sunset
Shows today's sun times along with a sunrise & sunset quality score — Forecast Bar's prediction of how colorful the sky will be. Tap the quality row to open the full quality forecast, with the color-potential score, the weather ingredients behind it, outcome odds, and a viewing plan. See Sunrise & Sunset Quality for how the score works and how to get notified about great ones.
Moonrise & Moonset
Shows moon times together with a realistic rendering of the current moon phase — the moon you see on screen matches the one in the sky.
Air Quality
The air quality index for your location, with category and pollutant details.
Pollen Count
Pollen levels for your location — handy on allergy mornings.
Stargazing Conditions
Answers one question: when is tonight worth going outside for, and how good will it be?
The panel opens on the best window Forecast Bar can find, with a rating — Excellent, Good, Fair or Poor — a plain-English summary, and the hours that window covers. Below it, a chart runs across the night. Drag along it and the rating, the time and the facts line all move to whatever hour is under your finger, so you can compare 10 p.m. against 2 a.m. rather than taking the single best answer.
Times are shown in the forecast location's own time zone, not yours — so checking the sky over a location three zones away gives you that location's night, not a translation of it.
Fair means "some interference." Here Fair sits below Good: cloud, moonlight, or haze is likely to interrupt the view. The same word means the same thing across all of Forecast Bar's sky ratings — event alerts, sky-event cards, and this panel. A functionally overcast sky is rated Poor outright.
Tap the panel for the full breakdown, which is not shown inline:
- What shapes the view — cloud cover (with low, mid and high layers, and a satellite cross-check), precipitation, visibility, humidity, dew-point spread, cloud ceiling, wind, and smoke or aerosol haze when either is present.
- Moonlight — how high the Moon sits, how much of it is lit, and how much it is interfering.
- Darkness — how dark the sky actually gets tonight.
- Artificial light — an estimate of your sky's brightness on a clear, moonless night, in magnitudes per square arcsecond, with how much light pollution impairs the view. This is a baseline for where you are: tonight's Moon and weather are scored separately on top of it.
Upcoming Sky Events
At the bottom of the stargazing forecast, Upcoming Sky Events opens the full catalog of eclipses, meteor showers, conjunctions and other sky events, with each event's best viewing time worked out for your selected location and the latest forecast. From 11.6 it is always there — the catalog used to be reachable only while an event was already close. A filter in the toolbar switches between Highlights and everything, or narrows the list to eclipses, meteors, the Moon, or planets. See Astronomy & Celestial Alerts to be notified about them.
When there is no window
Above roughly 55° latitude in local summer the sky never gets properly dark, and Forecast Bar says so rather than inventing a rating: "No dark window in the next 36 hours." If the forecast simply has not arrived yet, it says "Waiting for tonight's forecast" or "Conditions update with the next forecast" instead. All three are honest answers, not errors.
Tides
For coastal locations, a tide chart for the selected day, with:
- the tide station name and its distance from your location,
- high and low tide times, and
- the water temperature, when a station nearby reports one (the reading can come from a neighboring reference station, which is named alongside the value).
The all-data-points grid
Below the detail view is a grid of every data point available for the selected day. Tap any cell to switch the detail view to it. The grid is also customizable — press and drag cells to rearrange them (the "Drag to rearrange" hint at the bottom reminds you). Your order is remembered.
Every data point
These are the 22 data points available on the main screen and in the grid:
| Data point | What it shows |
|---|---|
| Temperature | Air temperature |
| Feels Like | Apparent temperature, combining wind and humidity |
| Heat Index | How hot it feels in heat + humidity |
| Wind Chill | How cold it feels in wind |
| Dew Point | Moisture saturation temperature |
| Humidity | Relative humidity |
| Pressure | Barometric pressure |
| UV Index | Sun exposure risk |
| Visibility | How far you can see |
| Cloud Cover | Percentage of sky covered |
| Wind Speed | Sustained wind |
| Wind Gusts | Peak gusts |
| Precip Chance | Probability of precipitation |
| Accumulation | Expected rain or snow amounts |
| Sunrise | Sunrise time + quality score |
| Sunset | Sunset time + quality score |
| Moonrise | Moonrise time + moon phase |
| Moonset | Moonset time + moon phase |
| Air Quality | Air quality index |
| Pollen Count | Pollen levels |
| Tides | Tide chart (coastal locations) |
| Stargazing Conditions | Tonight's best viewing window, rated |
Note: Air Quality, Pollen Count, Tides and Stargazing Conditions depend on data availability for your location — Tides in particular only appears near a coast, and Stargazing Conditions reports no window at all when the sky never gets dark.
Area Forecast Discussion
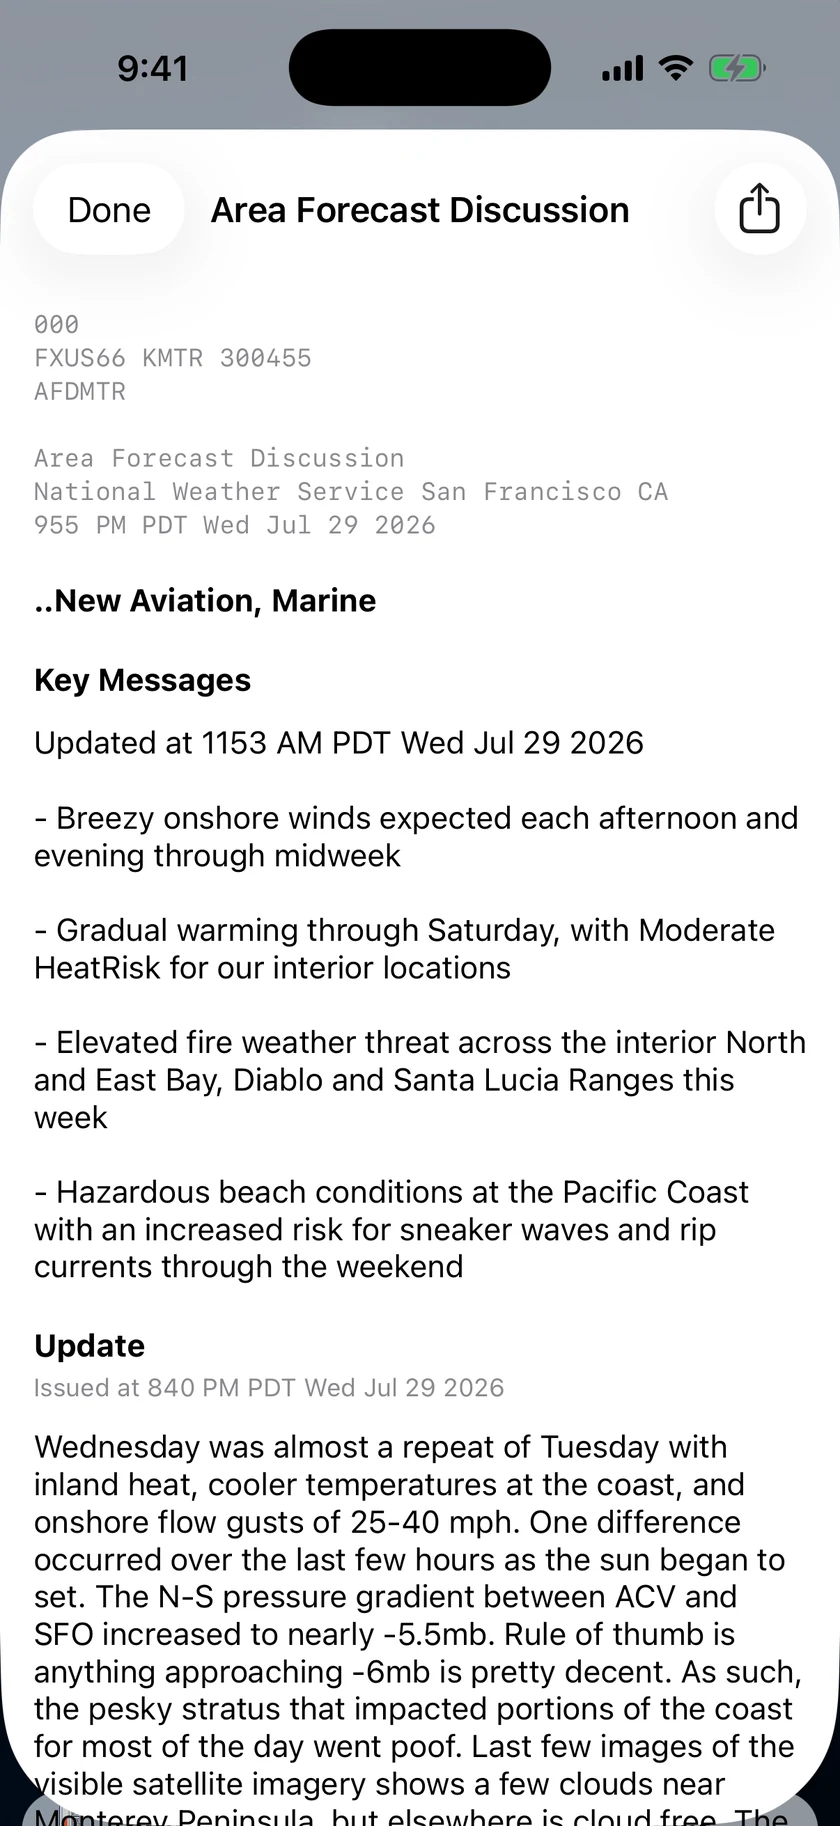
Tap the document icon in the toolbar to read the Area Forecast Discussion (AFD) — the technical write-up National Weather Service forecasters publish alongside each forecast, explaining their reasoning: which weather models they trust today, where the uncertainty is, and what could change. It's the closest thing to reading the forecaster's mind.
The discussion is a US National Weather Service product, so it's available for US locations only. Use the share button in the sheet to send the full text anywhere.
