Open Settings from the side menu: swipe in from the left edge (or tap the button in the top-left corner of the main screen), then tap Settings at the bottom.
The Settings hub
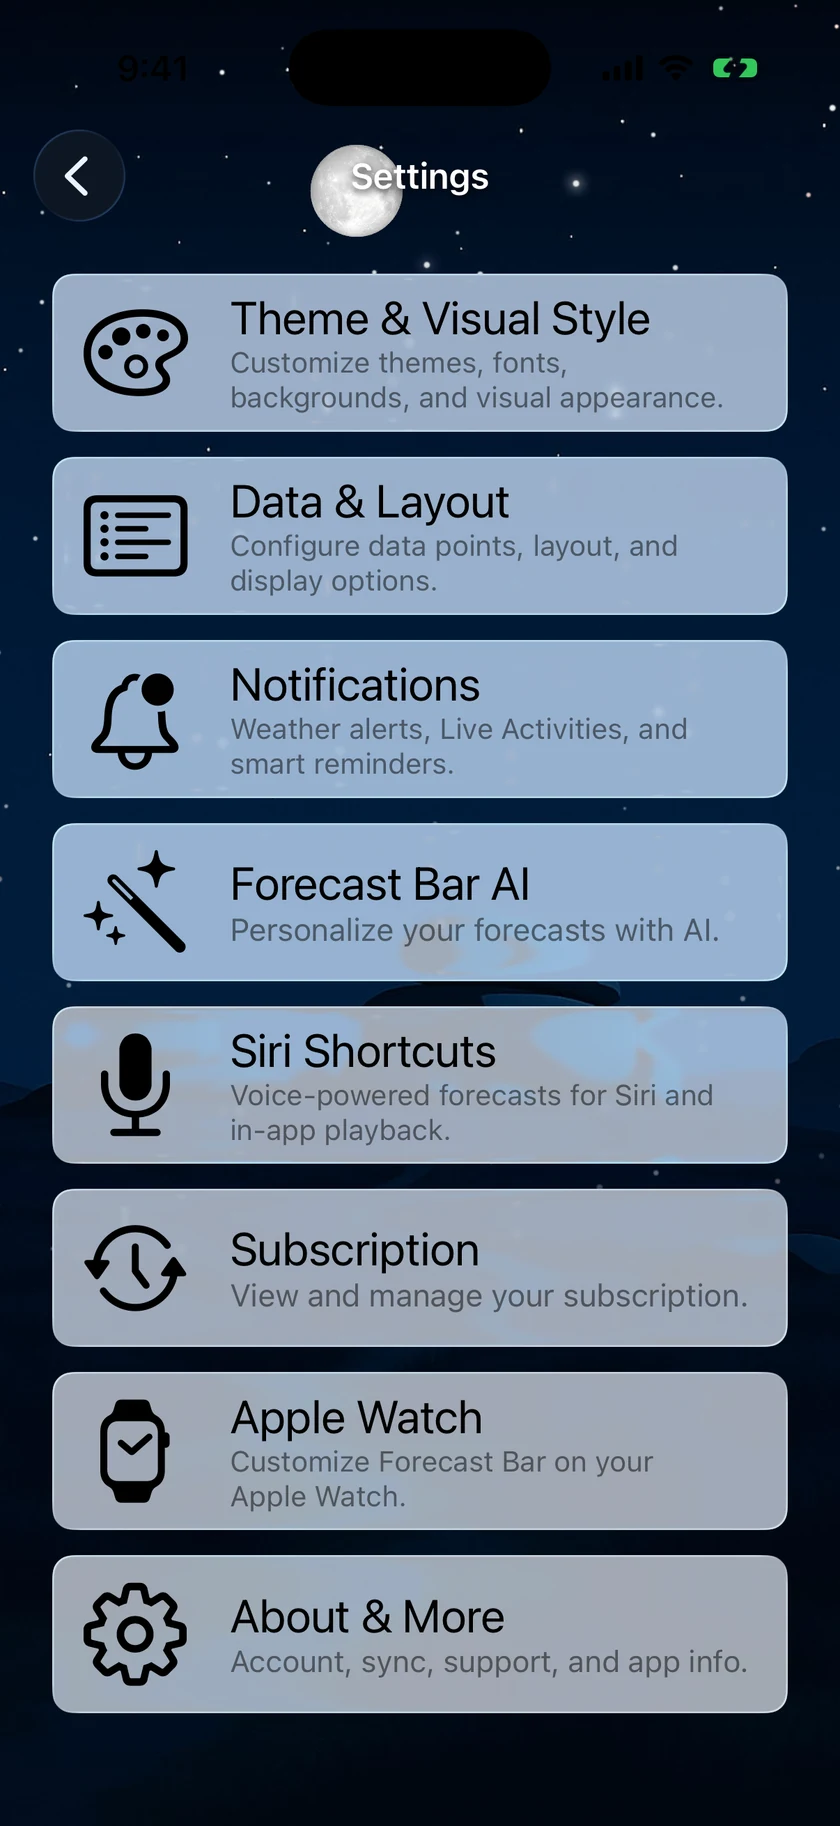
Settings is organized into these rows, in order:
| Row | What's inside |
|---|---|
| Theme & Visual Style | Everything visual — see Appearance & Themes |
| Data & Layout | Units, language, and how each section of the app is laid out — covered below |
| Forecasts | Precipitation, daily, hourly, and Visualize Day options, plus Hidden Alert Types — see Main Screen and Alerts & Notifications |
| Radar | Radar layers, behavior, and custom radar sources — see Radar |
| Compare & Home | The Compare Card, the compare button, weather change alerts, and your Home location — covered below |
| Notifications | All alert types — see Alerts & Notifications. Requires Silver; below that, this row opens the subscription screen |
| Smart Weather Stories | AI-written forecast stories — see Smart Weather Stories |
| Siri Shortcuts | Spoken forecasts — see Siri & Shortcuts |
| Subscription | View and change your plan — see Plans & Subscriptions |
| Apple Watch | Watch faces and complications (shown on iPhone only) |
| What's New | The release notes for the version you're running |
| User Guide | Opens this guide in your browser |
| Request a Feature | A short form that goes straight to the Forecast Bar team — covered below |
| About & More | Account, support, version, haptics, diagnostics, and legal — covered below |
Data & Layout
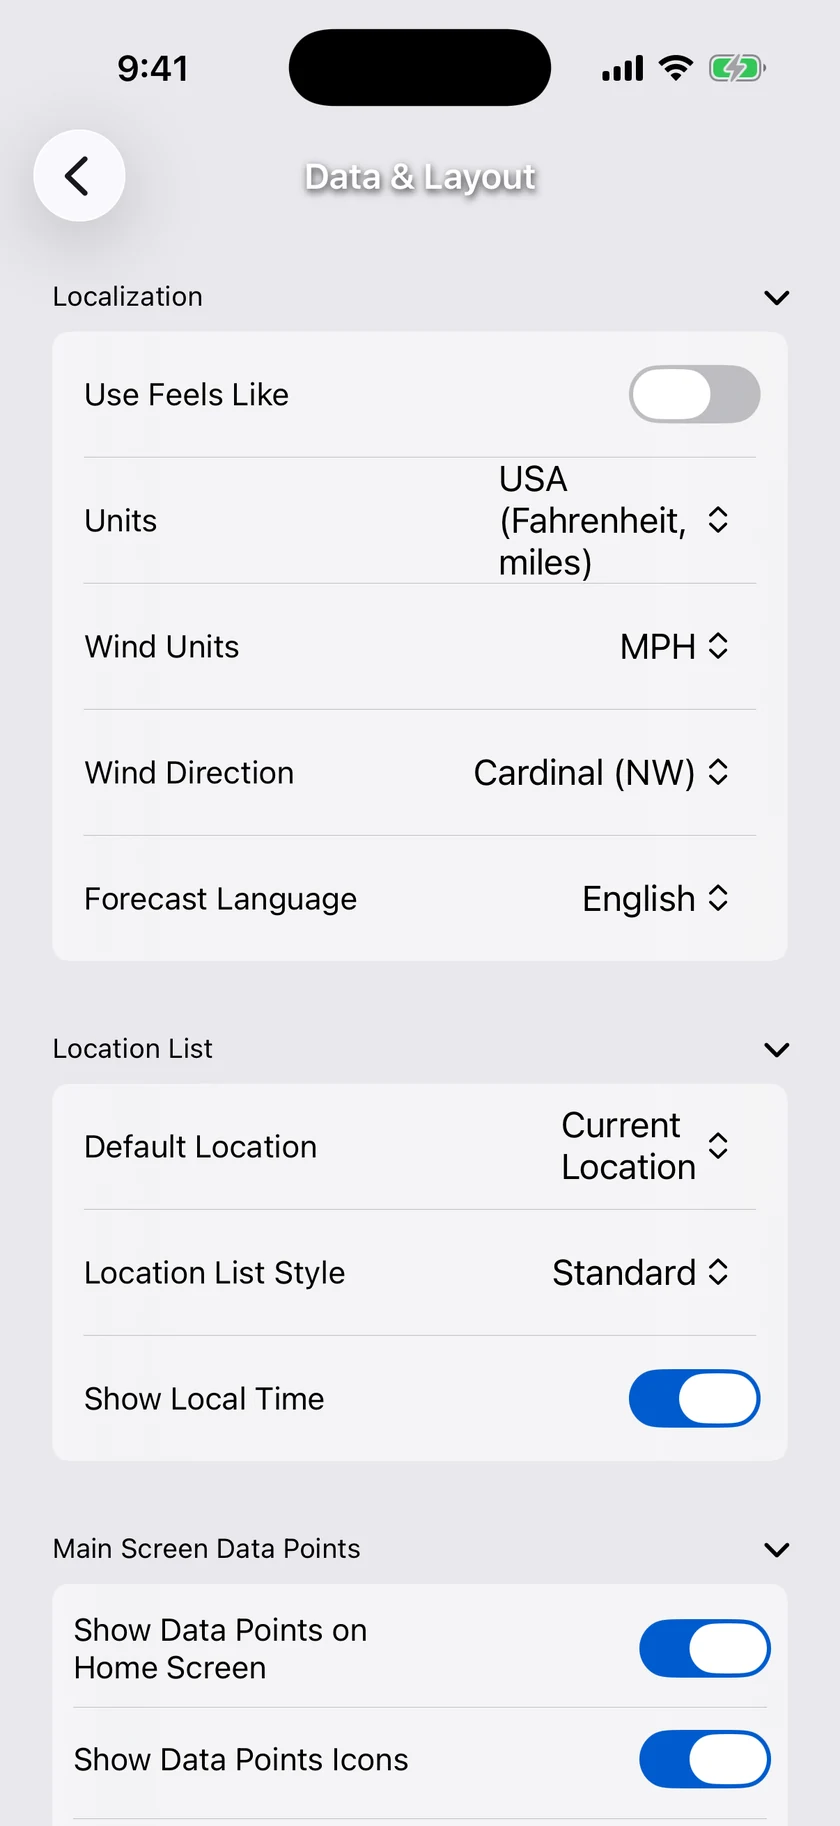
Settings → Data & Layout is a list of collapsible sections — tap a section title to expand it. The app remembers which sections you left open, and several sections show a live preview of the layout you're configuring.
Forecast Source
New in 11.6. The first section of Data & Layout chooses where your forecast comes from. Requires Gold — below Gold the picker shows a lock and opens the subscription screen.
| Setting | Options | Default |
|---|---|---|
| Forecast Source | The Weather Company, Apple Weather | The Weather Company |
- The Weather Company is the most complete source: 15-day forecasts, pollen, air quality and 15-minute precipitation.
- Apple Weather covers 10 days instead of 15 and writes no daily forecast text, so Forecast Bar composes the daily sentences itself. Switching to Apple Weather turns on AI Daily Forecasts to write the first few days (the section says so when it happens; turn it off again under Smart Weather Stories). Pollen, air quality, history and 15-minute precipitation keep coming from The Weather Company whichever source you pick, so nothing disappears when you switch.
- Compare Sources… opens the side-by-side comparison of the two forecasts for the location you're viewing — see Compare Sources on the main screen page. When enough history exists for your location, a line under the picker also reports which source has been more accurate there recently.
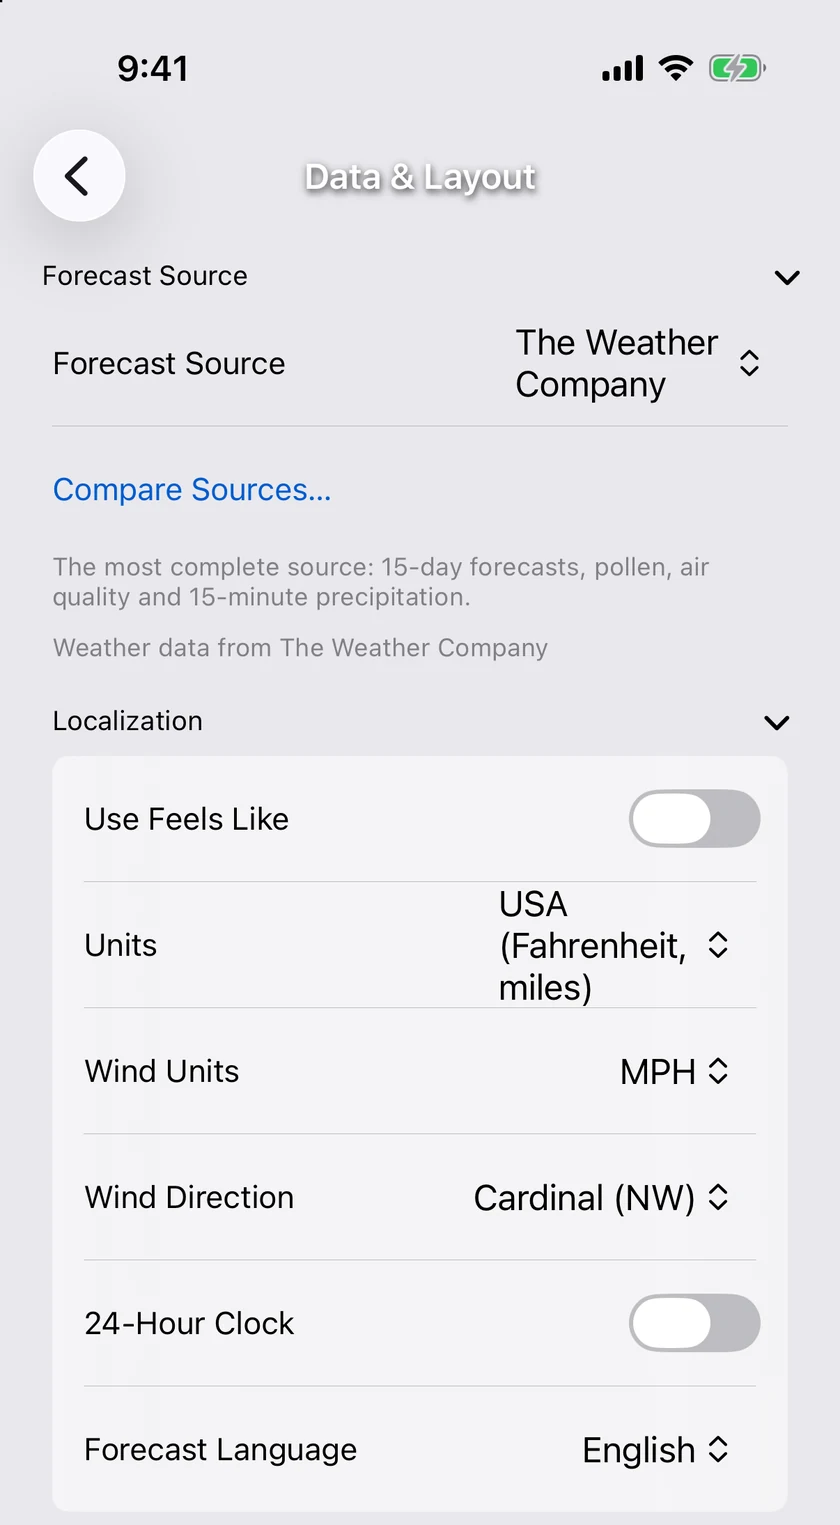
If Apple Weather can't be reached, the app falls back to The Weather Company for that refresh and says so here.
Note: Your forecast source syncs to your other devices along with your locations, even when layout sync (below) is off. On Apple TV the same choice lives under Settings → Units & Display.
Localization
| Setting | Options | Default |
|---|---|---|
| Use Feels Like | On / Off | Off |
| Units | USA, UK, Metric | USA |
| Wind Units | MPH, km/h, M/S, Knots | MPH |
| Wind Direction | Cardinal, Degrees, Both | Cardinal |
| 24-Hour Clock | On / Off | Off |
| Forecast Language | About 75 languages | English |
- Use Feels Like shows the "feels like" temperature in place of the actual temperature throughout the app.
- Units — USA is Fahrenheit with miles, UK is Celsius with miles, and Metric is Celsius with kilometers. Changing Units also updates Wind Units to match (MPH for USA and UK, km/h for Metric); you can still override Wind Units afterward.
- Wind Direction controls how direction is written: Cardinal shows
NW, Degrees shows315°, and Both showsNW 315°. - 24-Hour Clock writes every time as
14:30rather than2:30pm. It reaches further than the app's own screens: your widgets and your Apple Watch complications pick it up, and the times inside push notifications are formatted this way too, because the setting is sent to our servers when you change it. It also travels with settings sync, so turning it on once covers your other devices. - Forecast Language sets the language of forecast text, with about 75 options including Spanish, French, German, Italian, Portuguese, Japanese, Chinese, Korean, Russian, Arabic, Hindi, and Turkish — plus regional variants like French (Canada), Portuguese (Brazil), and six flavors of Spanish.
Note: Choosing any language other than English turns off Smart Weather Stories, which are currently English-only.
Location List
| Setting | Options | Default |
|---|---|---|
| Default Location | Current Location, Last Selected, or any saved location | Current Location |
| Location List Style | Standard, Compact | Standard |
| Show Local Time | On / Off | On |
- Default Location is where the app opens. Last Selected reopens whatever location you were viewing last; picking a saved location by name always starts there.
- Location List Style — Compact fits more locations on screen in the side menu.
- Show Local Time displays each location's local time next to its name in the side menu.
Smart Data Points
| Setting | Options | Default |
|---|---|---|
| Sort Data Points by Relevance | On / Off | On for new installs; Off if you had already arranged your tiles |
Sort Data Points by Relevance orders the data point grid by what matters right now — precipitation during storms, UV on sunny days, wind chill on cold windy nights, and tides rising through the three hours before each high or low. Turn it off, or simply drag a tile in the grid, to keep your own order.
Main Screen Data Points
These control the row of data tiles on the main screen.
| Setting | Default |
|---|---|
| Show Data Points on Home Screen | On |
| Show Data Points Icons | On |
| Show Labels | Off |
Tap Add or Remove Data Points to open the selector: check the points you want, drag to reorder them, and confirm with the checkmark. At least one data point must stay selected. You can choose from 21 points:
Sunrise, Sunset, Moonrise, Moonset, Temperature, Feels Like, Dew Point, Heat Index, Humidity, Pressure, UV Index, Visibility, Wind Chill, Wind Speed, Wind Gusts, Cloud Cover, Precip Chance, Accumulation, Air Quality, Pollen Count, and Tides.
Tip: You can also rearrange the tiles right on the main screen — long-press one and drag. Each tile opens its own detail screen; see Data Points.
Alerts
Show Severe Alerts in Toolbar (default off) moves active severe weather alerts out of the scrolling forecast and into a badge on the main screen's toolbar. See Alerts & Notifications for the alerts themselves.
Sync
Shown only while you're signed in. Sync Layout Across Devices (default on) is the twin of the appearance sync switch in Theme & Visual Style: turn it off and this iPhone or iPad keeps its own data points, layout and display options while your other devices carry on sharing theirs. Your forecast language, forecast source and locations keep syncing either way. Turning it back on repaints the screen with the shared layout immediately. See Sync Across Devices.
Compare & Home
Settings → Compare & Home gathers everything that puts one place next to another: the Compare Card, the compare button in the side menu, weather change alerts, and your Home location. It's a list of collapsible sections like Data & Layout.
Compare Card
Requires Gold. Shows current conditions and local time for up to five saved cities in a compact card on the main screen. Tap a city to open the full comparison, or use the arrow to switch to it. A city whose weather can't be fetched reads Unavailable until the next refresh.
| Setting | Options | Default |
|---|---|---|
| Show Compare Card | On / Off | Off |
| Position | Above or below the forecast | Above |
| Add City | Pick any saved location (up to five) | — |
| Add Home While Away | On / Off | On |
| Away Distance | A distance you choose | 25 miles |
Add Home While Away puts your Home location on the card automatically whenever you're farther from it than Away Distance.
Weather Change Alerts
Forecast Bar can flag notable weather changes with in-app comparison cards.
| Setting | Options | Default |
|---|---|---|
| Compare with Tomorrow | On / Off | On (High and Low temperature) |
| Compare with Yesterday | On / Off | On (High temperature) |
| Switch Time | Sunset, Custom Time | Sunset |
| Custom time (when Switch Time = Custom Time) | Time picker | 6:00 PM |
| Auto-dismiss | Never, 5, 8, 10, 15, 30 seconds | 8 seconds |
| Once Per Day | On / Off | On |
Tap the slider icon next to Compare with Tomorrow or Compare with Yesterday to fine-tune the comparison: each of the 6 parameters — High temperature, Low temperature, Humidity, Wind speed, Pressure, and Dew point — has its own on/off toggle and an adjustable threshold, so a card only appears when the change is big enough to matter to you.
Switch Time decides when the app stops comparing against today and starts looking at tomorrow (at sunset, or at a fixed time you choose). Auto-dismiss controls how long a change card stays on screen, and Once Per Day prevents repeats.
Location Compare Button
Compare two locations side by side. Requires Gold — see Plans & Subscriptions.
| Setting | Options | Default |
|---|---|---|
| Show Compare Button | On / Off | Off |
| Default View | Current, Hourly, Daily | Current |
Show Compare Button adds a compare button to each row in the side menu. Tap it on any location to open the compare screen with your selected location on one side and the tapped location on the other. The left column's header is a dropdown — tap it to swap in any other saved location. A floating tab bar at the bottom switches between Current, Hourly, and Daily comparisons (Default View picks which one opens first). Close with the X in the toolbar.
From 11.6 the Hourly and Daily tabs open as charts — two lines with the disagreement shaded between them, and paired high/low bars by day — with every measurement (temperature, precipitation, wind, humidity, UV and more) charted in one scrolling column. Drag across a chart and both cities' readings follow your finger. A List / Graph switch at the foot of the screen brings the columns back, and the Reorder charts button in the toolbar sets the order the charts appear in. The Current tab stays a table. The same charts power Compare Sources.
Home Location
Home Location pins one saved location near the top of your list and merges it with Current Location while you're there. You can also set it by editing a location in the side menu — see Locations. Whether Home joins the Compare Card while you're away is set in Compare Card above.
Precipitation Section
Controls the precipitation area near the top of the main screen.
| Setting | Options | Default |
|---|---|---|
| Show Precipitation Section | On / Off | On |
| Show Hourly Graph | On / Off | On |
| Show Mini Radar Map | On / Off | On |
| Show Mini Map Scrubber | On / Off | On |
| Default View | 1 Hour, 6 Hour, Radar | 1 Hour |
The mini radar map tab requires Gold and radar coverage at your location; if your chosen Default View isn't available, the section falls back to the next available tab.
Daily Forecasts
| Setting | Options | Default |
|---|---|---|
| Show Daily Section | On / Off | On |
| Daily Forecast Style | Summary, Compact | Summary |
| Show Today as Graph | On / Off | Off |
| Graph Hours (when Show Today as Graph is on) | 6 – 24 hours | 12 Hours |
| Condition Icons as Dots | On / Off | Off |
| Show Graph Picker | On / Off | On |
| Default to Precip Amount (Summary style) | On / Off | Off |
| Show Data Point Icons (Compact style) | On / Off | On |
| Expand Today's Forecast | On / Off | Off |
- Summary shows each day as a rich row with condition text; Compact shows a tighter row built from data points you choose.
- Show Today as Graph replaces today's row with an hourly graph covering the number of hours you pick.
- Default to Precip Amount shows precipitation amount instead of chance in Summary rows.
- Expand Today's Forecast opens today's row automatically when you launch the app.
Compact data points: in Compact style you configure Data Point 1–3 on iPhone (1–5 on iPad), plus a final slot (Data Point 4 on iPhone, 6 on iPad). Each slot can be None, Icon, Temperature Range, or any of: Sunrise, Sunset, Moonrise, Moonset, Temperature, Feels Like, Dew Point, Heat Index, Humidity, Pressure, UV Index, Visibility, Wind Chill, Wind Speed, Wind Gusts, Cloud Cover, Precip Chance, Accumulation, or Tides. Data Point 1 defaults to Precip Chance.
Hourly Forecasts
These options shape the hour-by-hour view inside an expanded daily row.
| Setting | Options | Default |
|---|---|---|
| Hourly Forecast Style | Graph, Timeline | Timeline |
| Show Icons (Timeline) | On / Off | On |
| Show Temperature as Curve (Timeline) | On / Off | Off |
| Show Style Changer in Forecast | On / Off | On |
| Default Data Point in Chart (Graph) | 14 data points | Temperature |
- Graph draws an interactive chart; Timeline lists each hour as a row. Show Style Changer in Forecast keeps a quick toggle between the two right in the forecast.
- Show Temperature as Curve staggers timeline rows to trace the temperature's rise and fall.
- Default Data Point in Chart (Graph style) can be: Temperature, Feels Like, Cloud Cover, Dew Point, Humidity, Precip Chance, Accumulation, Pressure, UV Index, Visibility, Wind Speed, Wind Gusts, Heat Index, or Wind Chill.
In Timeline style, tap Add or Remove Data Points to pick which columns each hour shows, from: Icon, Condition String, Temperature, Precip Chance, Accumulation, Wind Speed, Humidity, Humidity Feels Like, Feels Like, Cloud Cover, Dew Point, Heat Index, Pressure, UV Index, Visibility, and Wind Chill.
Visualize Day
New in 11.4. Controls the flythrough you open by pulling past refresh on the main screen — see The Main Screen.
| Setting | Options | Default |
|---|---|---|
| Pull Down to Visualize | On / Off | On |
| Show Condition Icon | On / Off | Off |
- Pull Down to Visualize is what arms the gesture. Turn it off to keep pull-to-refresh doing only that.
- Show Condition Icon adds the hour's condition icon beside the temperature in the readout that plays over the sky.
Radar
Sets defaults for the full-screen radar — see Radar for the radar screen itself.
| Setting | Options | Default |
|---|---|---|
| Default Layer | 2 Hour Radar, 18 Hour Radar, Global Radar, and every map layer (satellite, temperature, wind, aurora, and more) | 2 Hour Radar |
| Show Weather Overlay | On / Off | On |
| Next-Generation Radar | On / Off | On |
| Use Custom Radar | On / Off | Off |
| Custom Radar URL | Web address | Empty |
Use Custom Radar replaces the built-in radar with any radar website you like: enter its URL, using {lat} and {lng} as placeholders that the app fills in with your current coordinates.
Request a Feature
Settings → Request a Feature (under Help & Info) is a short form for telling the team what Forecast Bar should do next. Every request is read.
- Type — New feature (default), Improvement, Bug report, Design, or Something else.
- Summary — one line, like "Wind gusts on the lock screen widget".
- Details — optional: what it would do and when you'd use it. The more specific, the better.
- Email — optional, only if you'd like a reply.
- Screenshot (optional) — new in 11.6. Tap Add a screenshot to pick a picture of the screen you mean; it appears as a preview with Screenshot attached, and you can Remove it or Choose a different one. The image is resized and re-encoded on your device before it is sent, which also drops the original photo's metadata.
Tap Send Request. A confirmation appears once it's filed; if the request can't be sent, the form keeps what you typed so you can try again.
About & More
Settings → About & More gathers account, support, and housekeeping items.
Subscription
Shows your current plan — and its expiration date, when the App Store reports one — with Manage Subscription and Redeem Offer Code buttons. See Plans & Subscriptions.
Account & Sync
Shows whether you're signed in and when your settings last synced. Sync Now pushes your settings to the cloud immediately; Sign Out disconnects this device. When you're signed out, a Sign In with Apple button appears instead — signing in enables notifications and settings sync across your devices.
Support
- User Guide opens this guide in your browser.
- FAQ opens the Forecast Bar FAQ on the web.
Tip: The most detailed settings screens — Data & Layout, Theme & Visual Style, Notifications, Smart Weather Stories, and Siri Shortcuts — each end with a quiet "Learn more in the User Guide" line that jumps straight to that screen's page in this guide.
- Email Support starts an email to the support team with your support ID pre-filled, so we can look up your account right away.
Version
The app version and build number — handy to include in support requests.
Join our Beta
Join TestFlight Beta opens the public TestFlight page where you can try pre-release versions of Forecast Bar.
Haptics
Haptic Feedback controls vibration:
| Option | What it does |
|---|---|
| Off | Disables all vibration |
| Important Only | Vibrates for key alerts and navigation |
| All Feedback (default) | Vibrates for most taps and toggles |
Notification Diagnostics
If notifications aren't arriving, tap Test Notifications to open a self-service diagnostic tool:
- Run Notification Test checks your permission status, push registration, and server connection.
- Any issues found are listed with a fix for each.
- Send Test Notification delivers a real push to this device so you can confirm the fix.
- Force Refresh Push Token re-registers the device with the notification server.
- Copy Diagnostic Report for Support builds a text report you can paste into a support email.
This screen also shows your Notification ID, User ID, and Device ID — all selectable so you can copy them for support. A Test Live Activity button lets you preview the precipitation Live Activity with sample data.
Debug Options
A small set of self-help tools: reset the in-app tutorial, reload your Home and Lock Screen widgets, reset Live Activity state, preview the welcome walkthrough again, and a few reset switches for synced settings. These are safe to use — they only affect this device's local state.
Legal
- Powered by The Weather Company and Powered by Apple Weather — attribution for Forecast Bar's weather data sources.
- Terms of Service and Privacy Policy.
- Remove Cloud Data permanently deletes your synced settings from Forecast Bar's servers (the app asks you to confirm first).
