Forecast Bar offers 25 complications for your watch face, from a simple temperature readout to a rich 5-hour timeline with rain bars. They come in the four standard watch face slot shapes: Circular (small round), Corner (curved into a corner), Inline (the text line above the time), and Rectangular (the large panel).
Complications use the same weather data as the watch app, so they require the same Silver or Gold subscription — and two of them (AQI and Tides) need Gold. See Plans & Subscriptions.
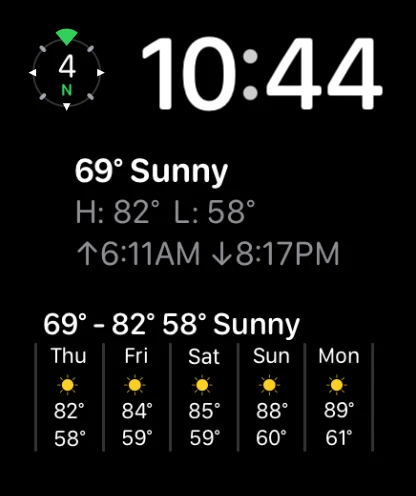
Adding a complication to a watch face
- Long-press your watch face, then tap Edit.
- Swipe to the Complications screen and tap the slot you want to fill.
- Scroll to Forecast Bar and pick a complication from the list.
- Press the Digital Crown to save, then tap the face to activate it.
There's nothing to configure on the watch itself — every option lives on your iPhone (see Configuring from your iPhone below).
Temperature and Feels Like
Six variations on the current temperature. In a Circular slot, Temperature renders as a gauge with the current reading in the center and today's low and high at the ends, colored by temperature.
| Complication | Slots | Shows |
|---|---|---|
| Temperature | Circular, Corner, Inline | Current temperature |
| Temperature + Condition Icon | Circular, Corner | Current temperature with the weather icon |
| Temperature + Condition | Inline | Current temperature with the condition text |
| Feels Like | Circular, Corner, Inline | Apparent temperature |
| Feels Like + Condition Icon | Circular, Corner | Apparent temperature with the weather icon |
| Feels Like + Condition | Inline | Apparent temperature with the condition text |
Data point complications
One complication per data point. In Circular slots most render as a small gauge; Corner slots pair the value with a curved arc (for example, Humidity runs 0–100 between a cactus and a droplet, and AQI uses the six-color air quality scale); Inline slots read like "Temp 72°".
| Complication | Slots | Shows |
|---|---|---|
| Cloud Cover | Circular, Corner, Inline | Current cloud cover percentage |
| Dew Point | Circular, Corner, Inline | Current dew point |
| Heat Index | Circular, Corner, Inline | Current heat index |
| Humidity | Circular, Corner, Inline | Current relative humidity |
| Pressure | Circular, Corner, Inline | Barometric pressure (inches or millibars, matching your units) |
| Sunrise | Circular, Corner, Inline | Today's sunrise time |
| Sunset | Circular, Corner, Inline | Today's sunset time |
| UV Index | Circular, Corner, Inline | Current UV index |
| Visibility | Circular, Corner, Inline | Current visibility (miles or kilometers) |
| Wind Chill | Circular, Inline | Current wind chill |
| Wind Gusts | Circular, Inline | Gust speed and direction on a compass-style dial |
| Wind Speed | Circular, Corner, Inline | Wind speed and direction on a compass-style dial |
| Weather Condition Icon | Circular, Corner | Just the current weather icon |
| AQI — Gold | Circular, Corner, Inline | Current air quality index with its rating (Good, Moderate, and so on) |
| Tides — Gold | Circular, Corner, Inline, Rectangular | Current tide height and trend; the rectangular version adds the next high or low tide time |
Without Gold, the AQI complication shows a small locked placeholder instead of data.
Rich rectangular complications
The four most powerful complications use the large rectangular slot, and each has its own customizer on the iPhone.
| Complication | Slots | Shows |
|---|---|---|
| Smart | Rectangular | A 5-hour timeline with rain bars during precipitation, an optional title row, an optional per-hour data point, and a configurable switch to day columns in the evening |
| 5 Day Forecast | Rectangular | Five days with icons and high/low temperatures |
| Data Point Graph | Rectangular | A line chart of one data point over the next 5 hours |
| Custom | Rectangular, Inline | Three text rows you compose yourself from 18 data options |
The Smart complication earns its name: during precipitation, affected hours swap their icon and temperature for a mini rain chart; late in the evening (at an hour you choose) the last columns become day columns so you're looking at tomorrow instead of overnight hours; and in the very early morning it shows the 5-day layout.
Configuring from your iPhone
All complication options live in the Forecast Bar iPhone app under Settings → Watch. Pick a complication from the gallery there to open its customizer — a live preview updates as you change options. When you're done, sync your changes to the watch (see Syncing your changes below).
Smart
Opened from the Smart Weather entry in Settings → Watch.
| Option | Default | Choices |
|---|---|---|
| Show Title | Off | On/Off — adds a title row above the timeline |
| Title Data Point | Condition | Condition, Cloud Cover, Dew Point, Feels Like, Humidity, Precip Chance, Pressure, UV Index, Visibility, Wind, Sunrise, Sunset |
| Show High First | On | On/Off — order of high/low in the title row |
| Use Colored Title | Off | On/Off |
| Show Data Point | Off | On/Off — adds a per-hour value line under the timeline |
| Secondary Data Point | Precip Chance | Cloud Cover, Dew Point, Feels Like, Humidity, Precip Chance, Pressure, UV Index, Visibility, Wind Gusts, Wind Speed |
| Show Precip Background | On | On/Off — the rain-bar treatment during precipitation |
| Use Feels Like | Off | On/Off — apparent temperatures throughout |
| Show Tomorrow's Forecast At | 7:00 PM | Never, Always, or any hour from 12:00 PM to 11:00 PM |
| Days to Show | 5 | 0, 1, 2, 3, 4, 5 |
5 Day Forecast
| Option | Default | Choices |
|---|---|---|
| Show Title | Off | On/Off |
| Data Point | Condition | Condition, Cloud Cover, Dew Point, Feels Like, Humidity, Precip Chance, Pressure, UV Index, Visibility, Wind, Sunrise, Sunset |
| Use Colored Title | Off | On/Off |
Data Point Graph
| Option | Default | Choices |
|---|---|---|
| Show Title | Off | On/Off |
| Title Data Point | Condition | Condition, Cloud Cover, Dew Point, Feels Like, Humidity, Precip Chance, Pressure, UV Index, Visibility, Wind, Sunrise, Sunset |
| Use Colored Title | Off | On/Off |
| Graphed Data Point | Temperature | Cloud Cover, Dew Point, Feels Like, Humidity, Precip Chance, Pressure, Temperature, UV Index, Visibility, Wind Gusts, Wind Speed |
The chart plots now plus the next four hours as a smooth line with dot markers, colored to suit the data point (blue for dew point and precip chance, green for UV and wind, and so on).
Custom
Compose your own three-row complication. A live preview at the top of the customizer shows exactly what you'll get.
| Option | Default |
|---|---|
| Show Condition Icon | Off |
| Top Row | Current Temp and Condition |
| Middle Row | High/Low |
| Bottom Row | Sunrise/Sunset |
Each of the three rows can show any of these 18 options: Current Temp and Condition, Cloud Cover, Dew Point, Feels Like, Heat Index, High/Low, Humidity, Next Calendar Event, Pressure, Smart Summary, Sunrise/Sunset, Temperature, Tides, UV Index, Visibility, Wind Chill, Wind Gusts, Wind Speed. Rows render like "Clouds: 40%", "H: 85° L: 67°", or "↑6:54AM ↓7:52PM". A Tides row simply stays empty at locations without tide data.
Syncing your changes
After changing complication options on the iPhone, Forecast Bar shows a sync prompt: open Forecast Bar on your watch, scroll down and tap Sync Settings, then press Sync Now back on the iPhone. If you see "You must have the 'Sync Settings' screen open on your Watch," open that screen on the watch first and try again.
Updates and stale data
Complications refresh in the background about every 30 minutes. If the watch can't get fresh data for an extended stretch — beyond about 3 hours — complications show -- instead of an outdated reading. Opening the watch app (or tapping Refresh at the bottom of it) fetches fresh data and reloads your complications.
Tip: If complications show -- or seem stuck, open the watch app once to force a refresh — and check that your subscription is active, since complications don't update without one.
